
This workshop will be conducted by the (Art)ScienceBLR at the Srishti School of Art, Design and Technology.
In this workshop, we will look at different ways of gathering and disseminating information about pollutants in water. We will build devices to test for water quality, design maps and conceptualize ways of visualizing this data. We will also collect stories about water sources and water sheds. This workshop is ideal for students interested in Visual communication, Film, product design and those interested in environmental activism.
Within the broad framework of the Biodesign project, we had two main objectives:
1. How do you get community participation in gathering data?
2. How do you make this data more meaningful to the average citizen?
These are questions that have been raised not only during the course of the workshop but were also raised when we visited our partners LifePatch and EPFL.
This is the documentation from the workshop.
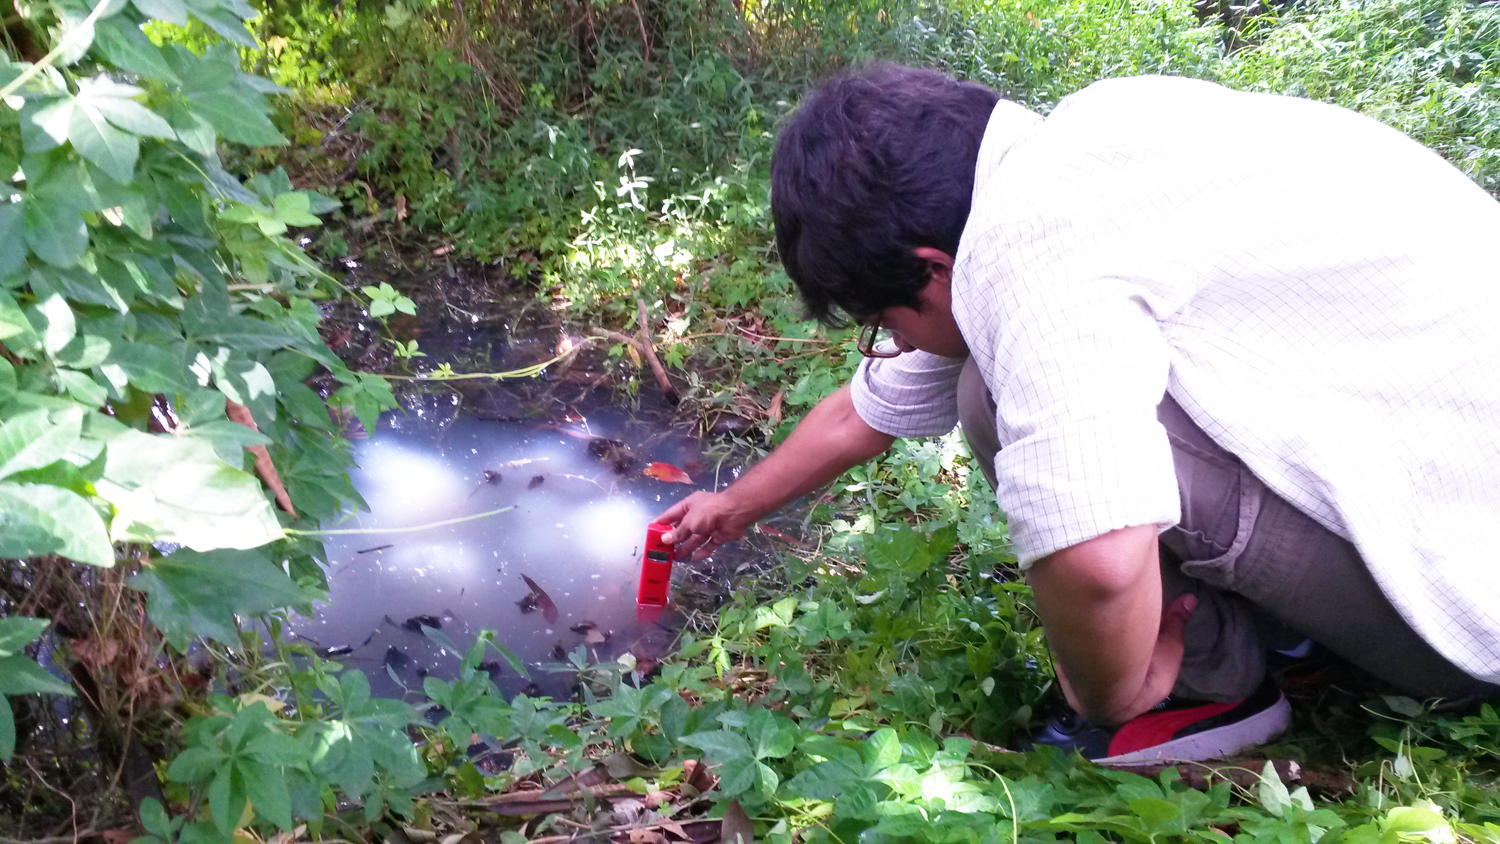
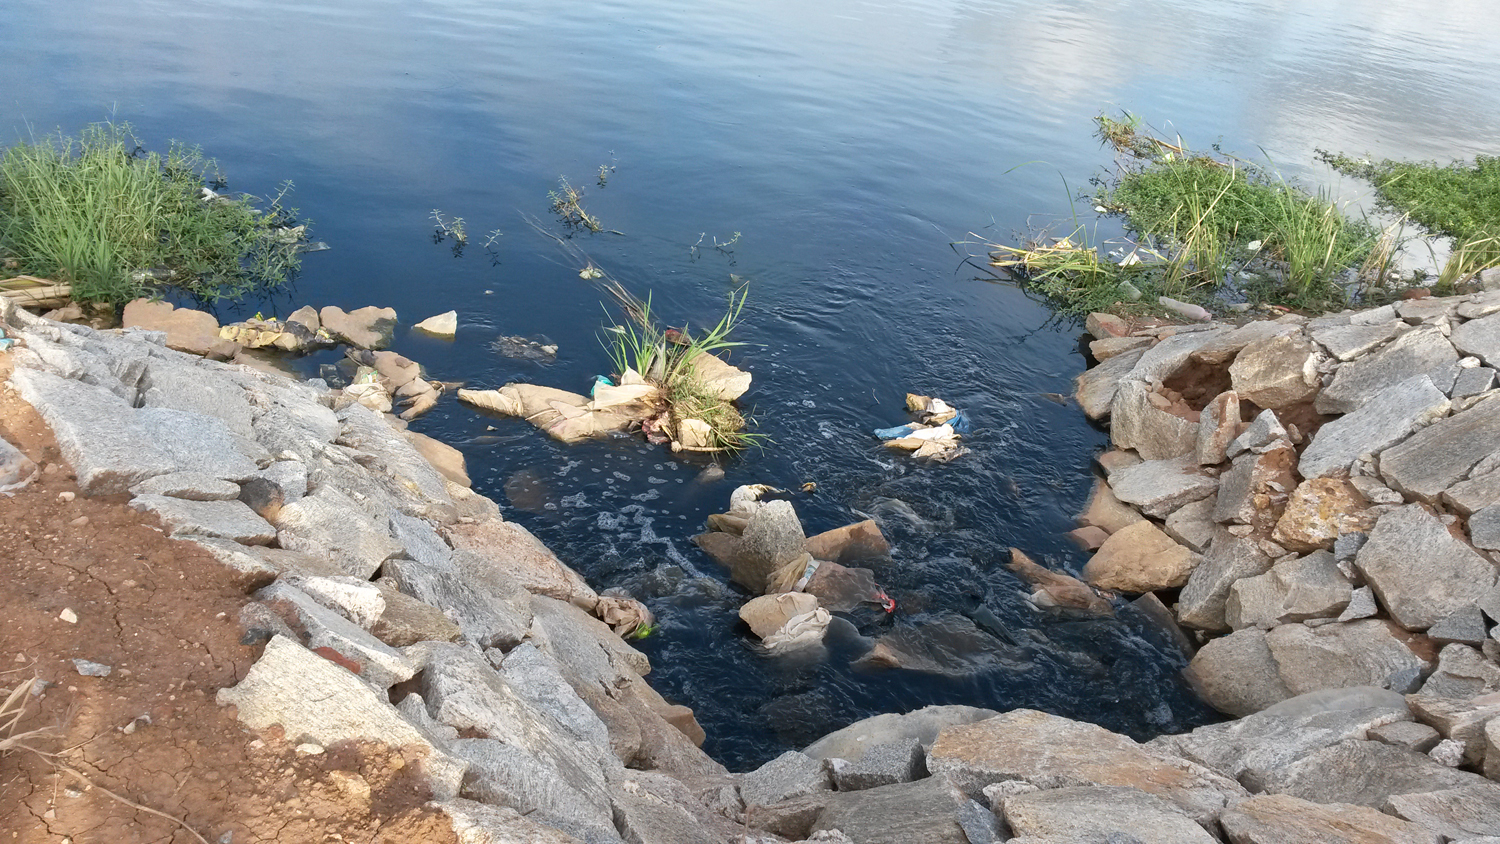
1. Collecting Data
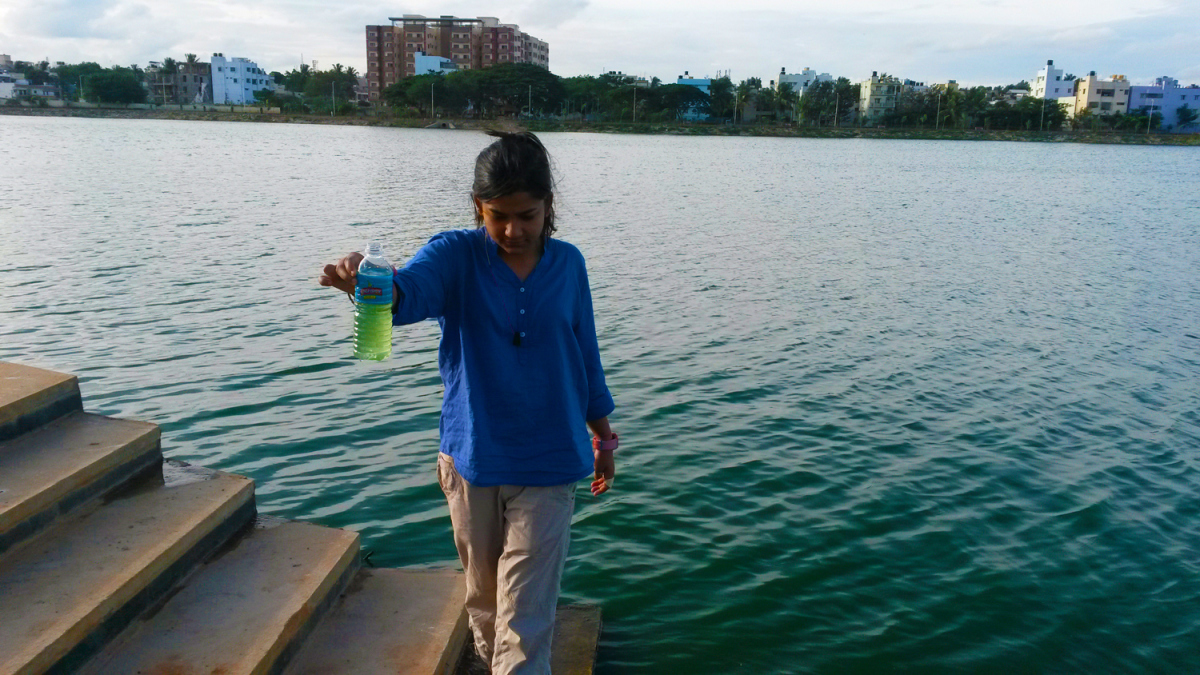
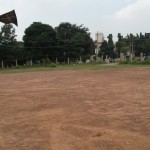
For the workshop, we decided to focus on water bodies around Yelahanka. We went to two lake; Puttenahalli lake and Allalasandra Lake.

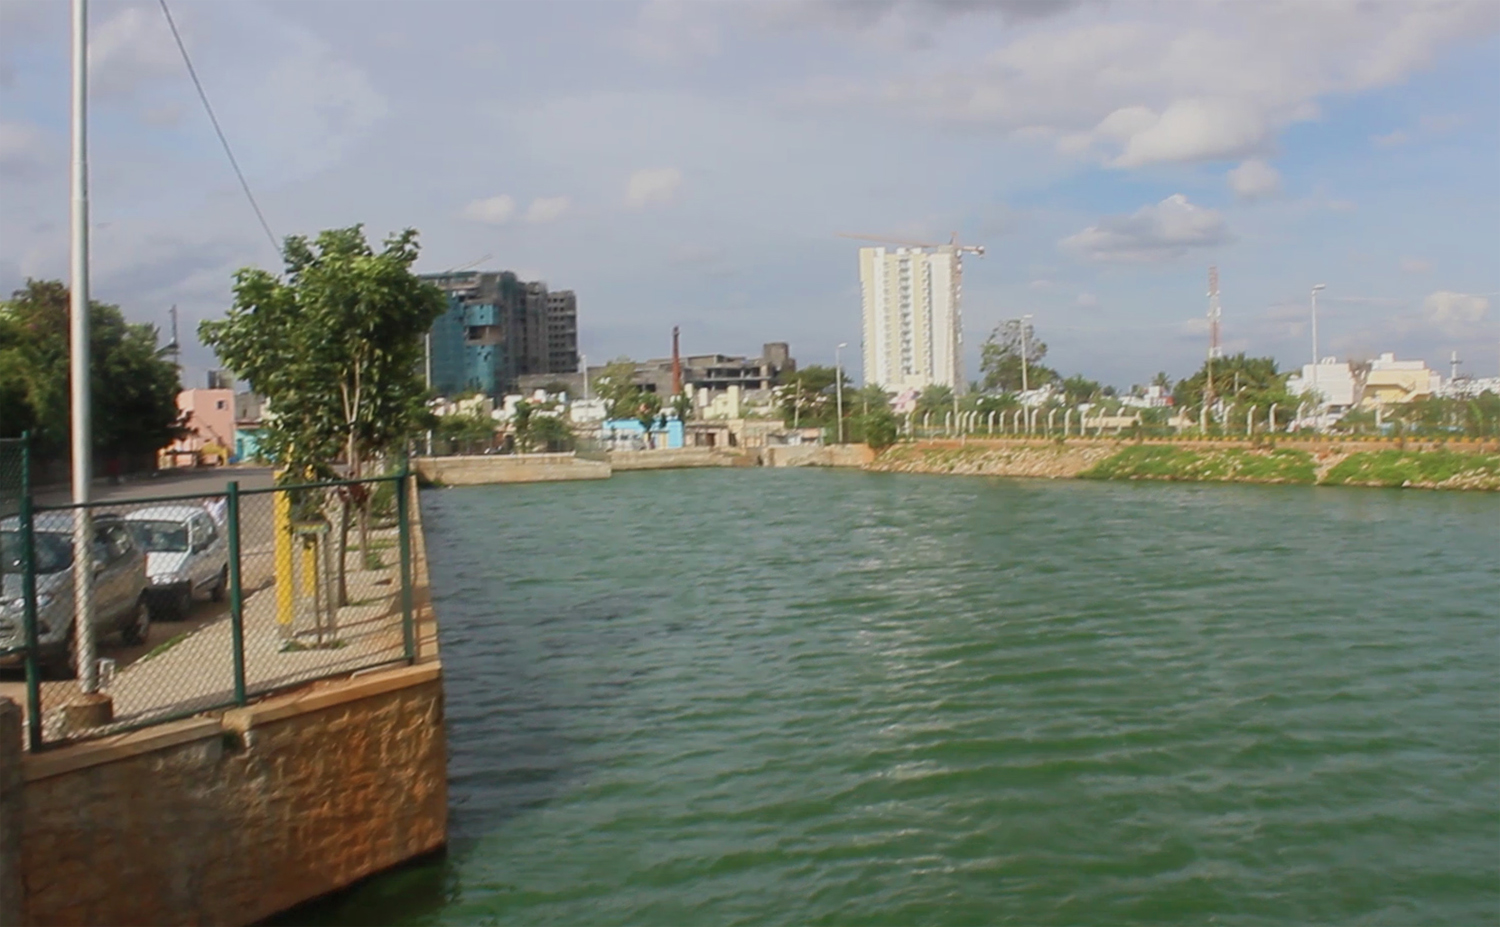


Allalasandra lake


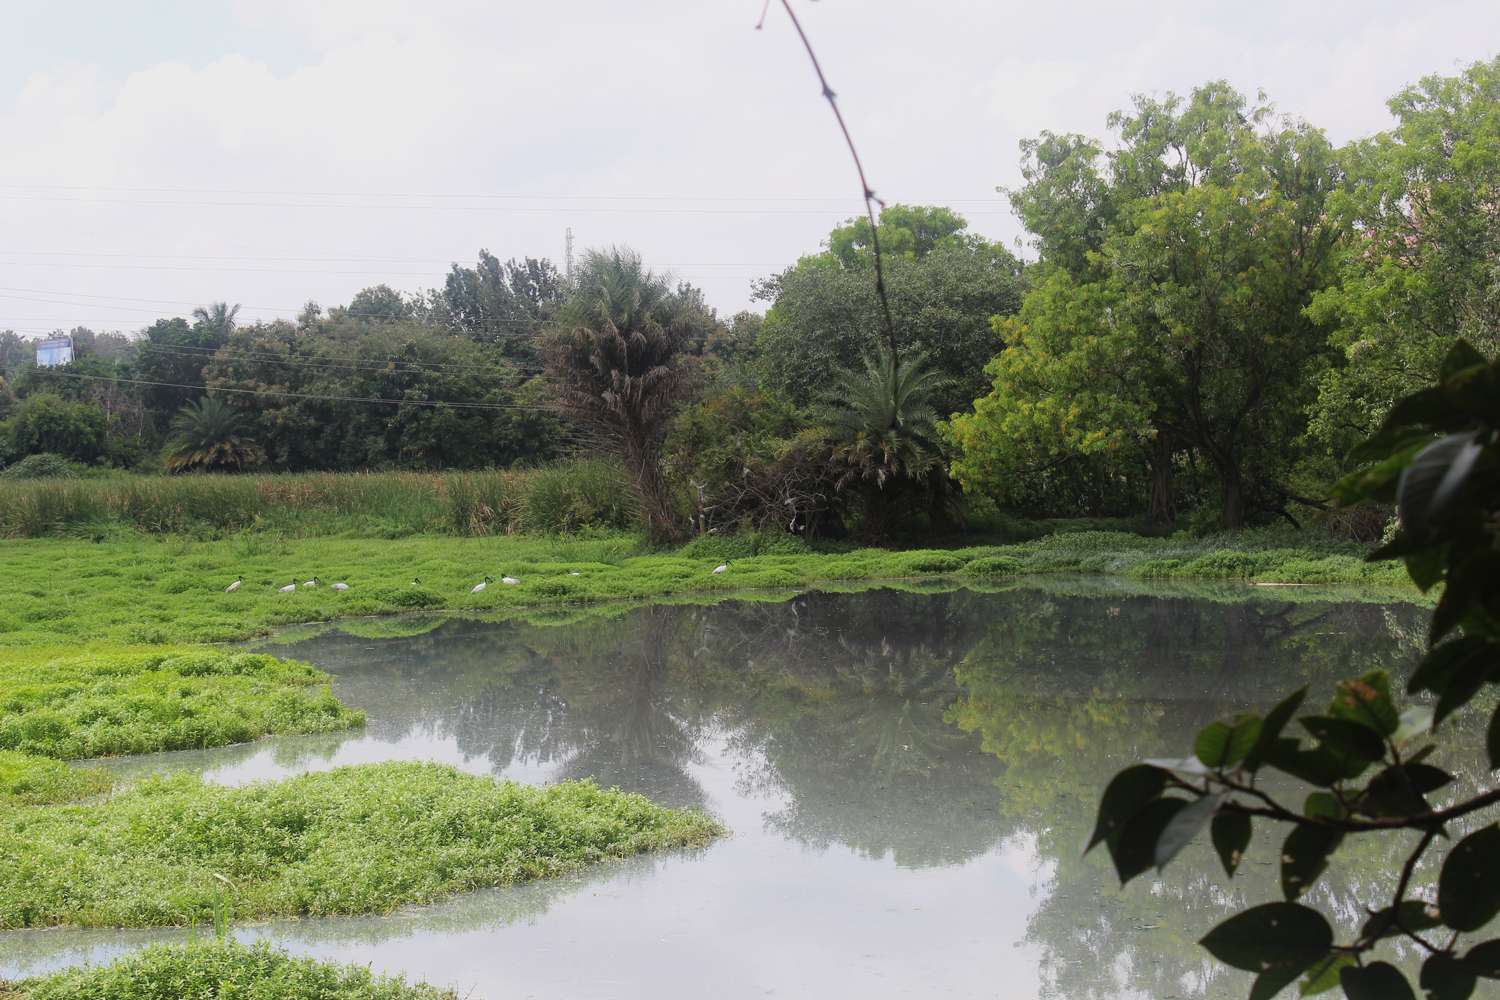
Puttenahalli Lake
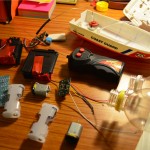
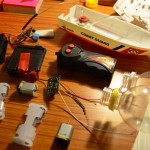
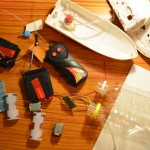
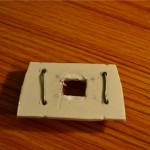
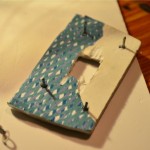
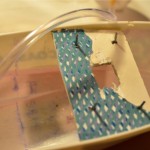
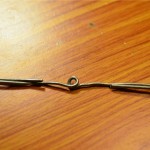
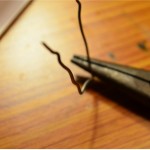
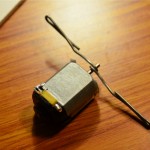
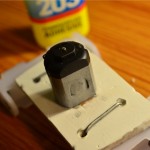
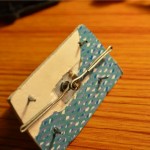
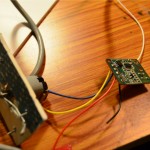
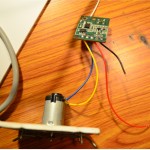
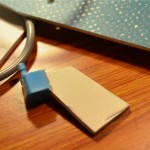
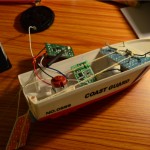
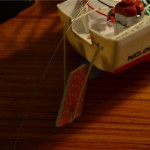
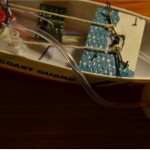
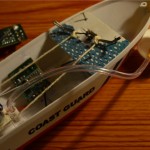
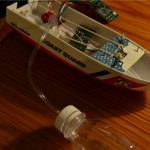
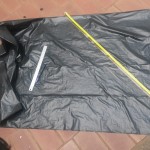
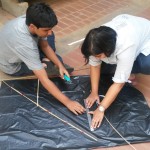
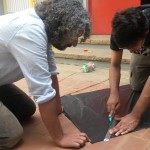
Collecting Data can be a fun community project. Inspired by Gabriella Levine‘s bots and community workshops, and the Tech4Dev waterhackathon, which Gabriella mentored, along with Akbar from our partner Lifepatch, we constructed a boat-bot to collect water samples. Instructions on how to build the boat can be found below.
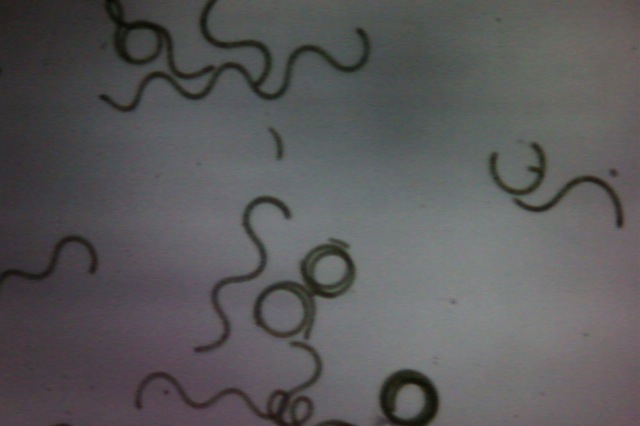
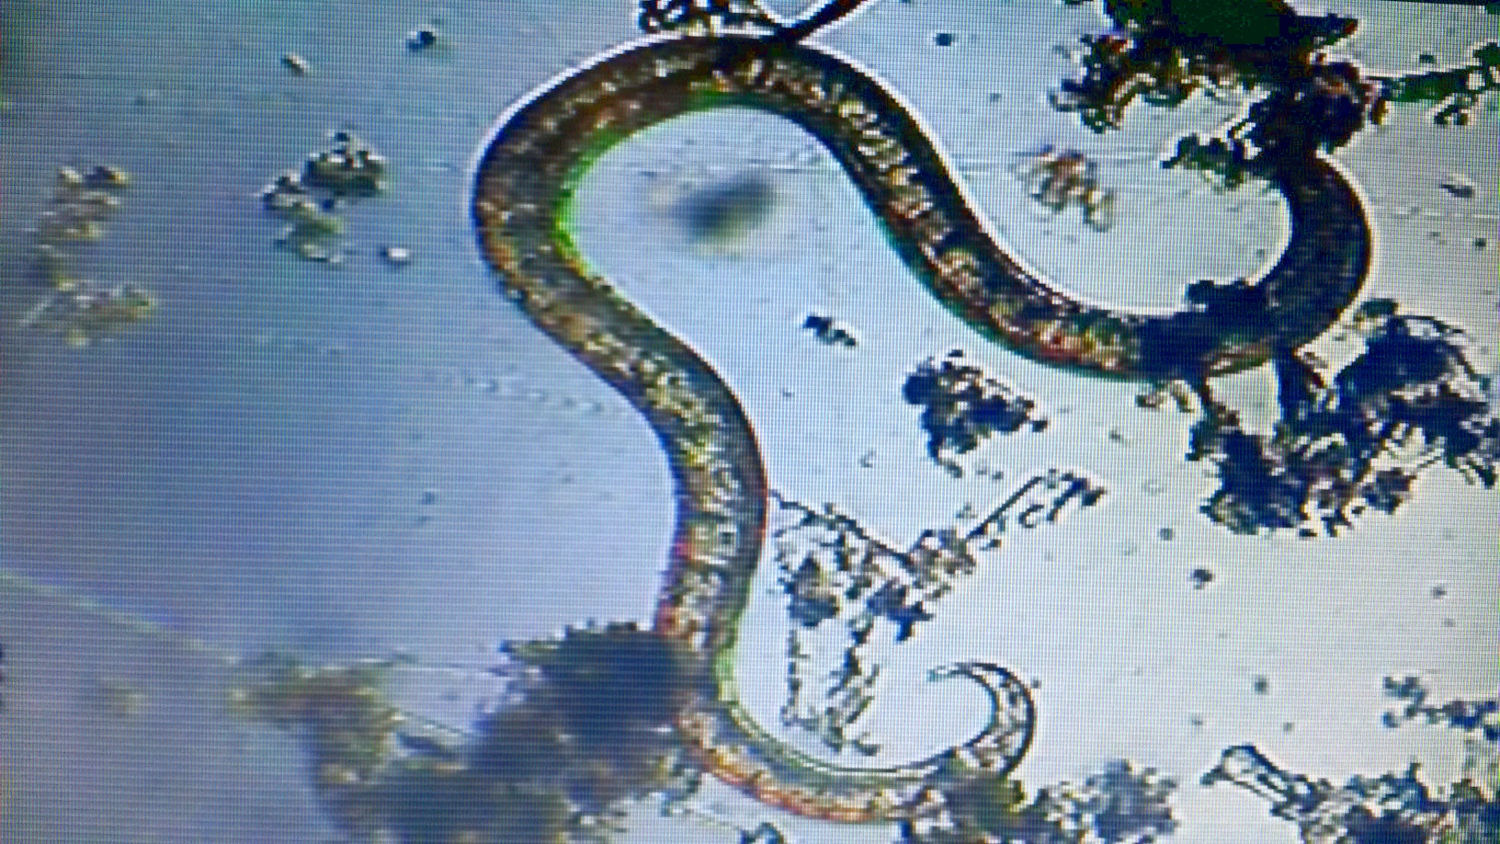
2. Analyzing the Data:

3. Data for Human Beings.Once this data was recorded, the next step was to design a data-base that would serve as back-end for the maps. An important requirement in the design of this database will be its ability to serve other kinds of data-not just numbers and values but also images and videos- these images and videos will make this whole exercise more engaging to the viewers.We took the first step in designing the basic architecture of the database. A snapshot of it is given below: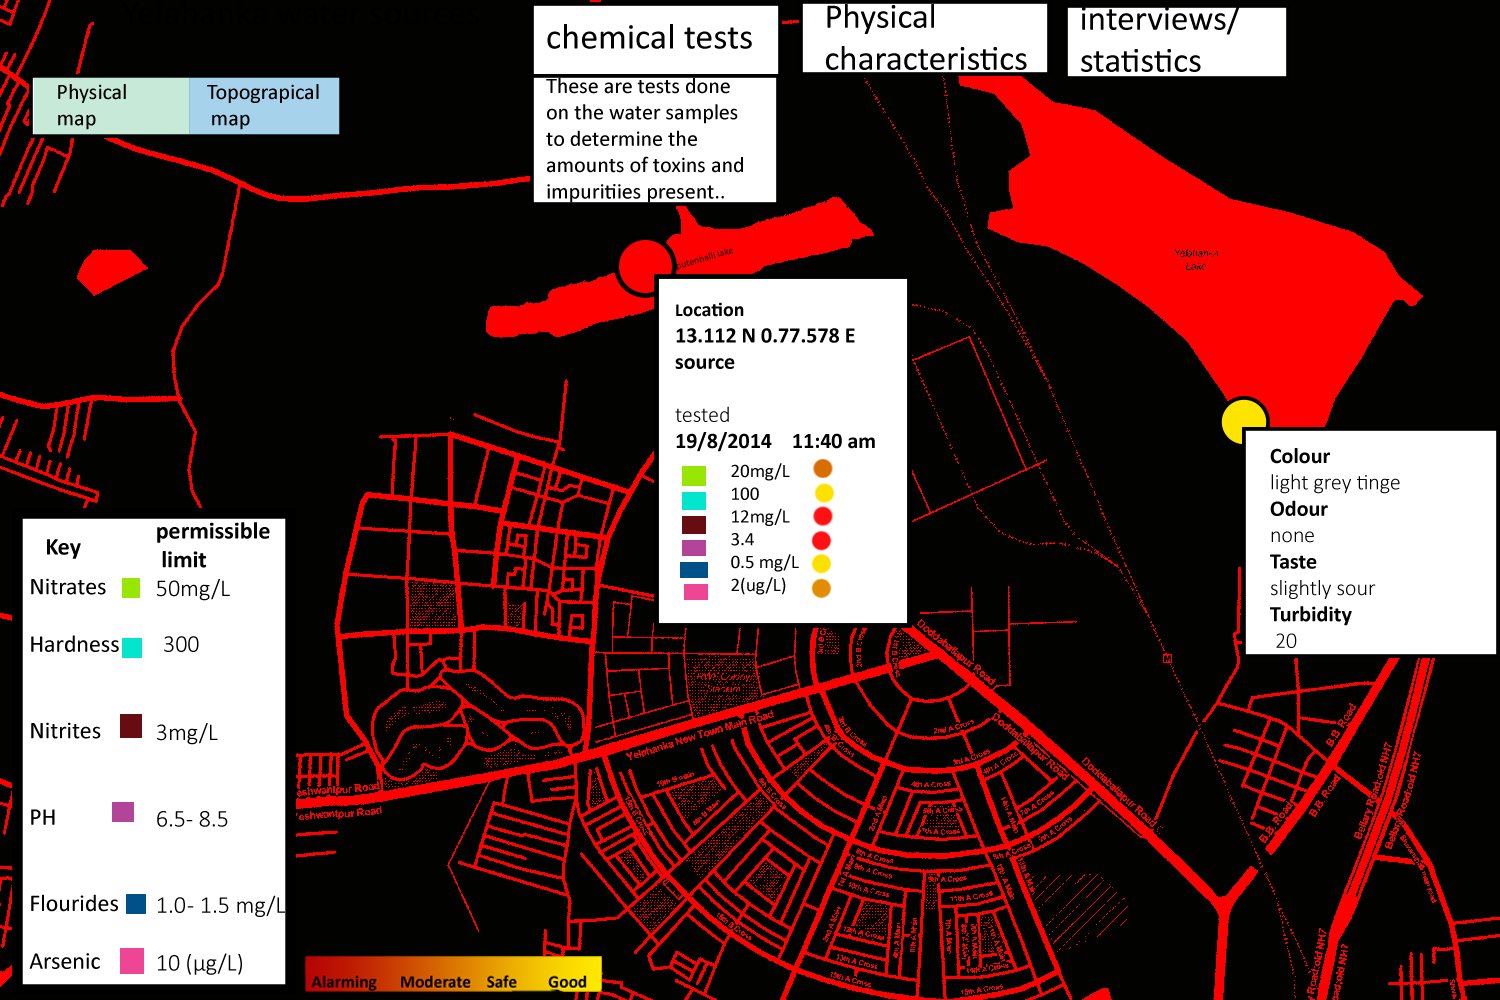
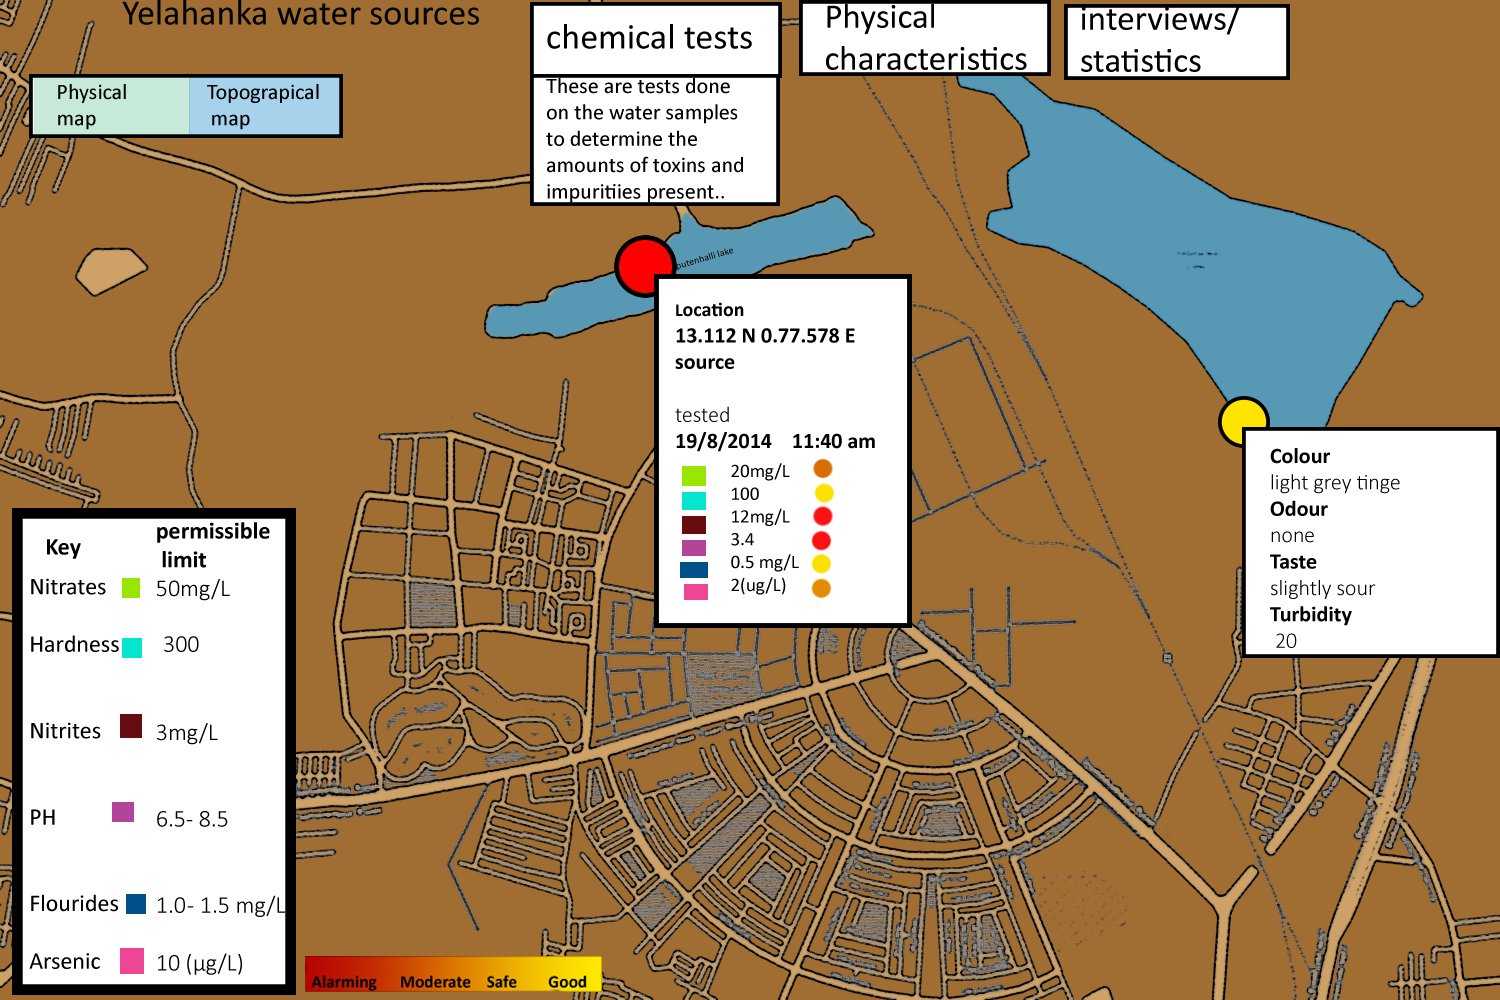 5. Making Maps.
Kite Mapping
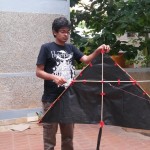
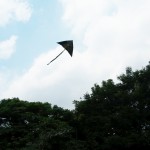
publiclab.org/wiki/kite-mapping